S&P500 Trading Update 28/4/26

S&P500 Trading Update 28/4/26
***QUOTING ES1! FOR CASH US500 EQUIVALENT LEVELS, SUBTRACT POINT DIFFERENCE***
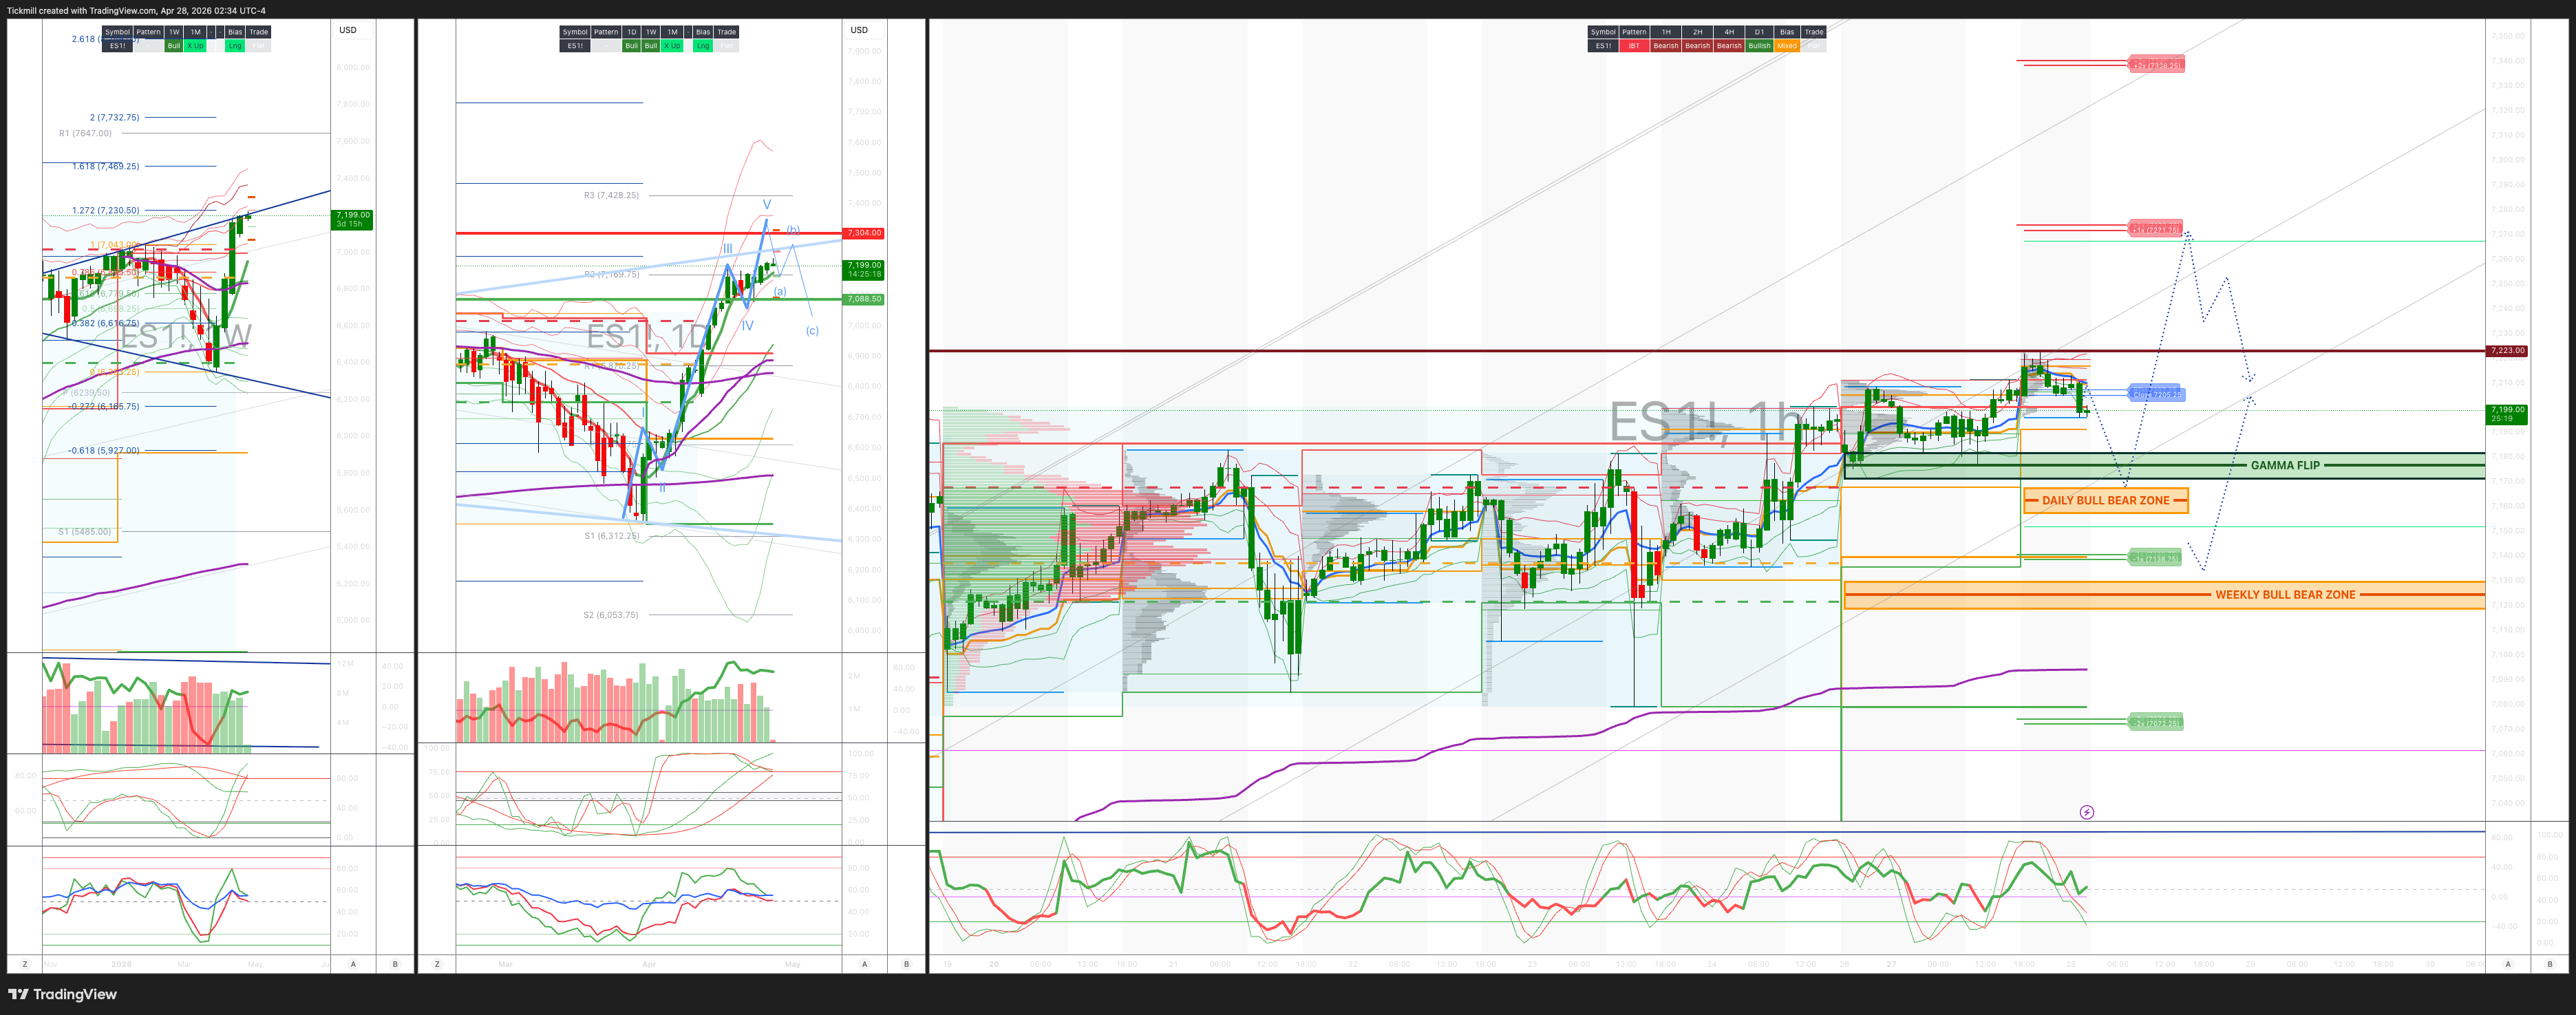
WEEKLY BULL BEAR ZONE 7130/20
WEEKLY RANGE RES 7304 SUP 7087
May OPEX Straddle: 225pt range implies a OPEX to OPEX range of [6900, 7350]
June QOPEX Straddle is 546.4pt giving us a range of [5960,7052]
JHEQX Q2 Collar 6189/6290 - 6865/6955
DEC2025 OPEX to DEC2026 OPEX is 945 points giving us a range of [5889,7779]
SPX PUT/CALL RATIO 1.18 (The numbers reflect options traded during the current session. A put-call ratio below 0.7 is generally considered bullish, and a put-call ratio above 1.0 is generally considered bearish)
DAILY VWAP BULLISH 7145
WEEKLY VWAP BULLISH 6819
MONTHLY VWAP BULLISH 6815
DAILY STRUCTURE – OTFH - 7145
WEEKLY STRUCTURE – OTFH - 7079
MONTHLY STRUCTURE - BALANCE
Balance: This refers to a market condition where prices move within a defined range, reflecting uncertainty as participants await further market-generated information. Our approach to balance includes favouring fade trades at the range extremes (highs/lows) while preparing for potential breakout scenarios if the balance shifts.
One-Time Framing Higher (OTFH): This represents a market trend where each successive bar forms a higher low, signalling a strong and consistent upward movement.
One-Time Framing Down (OTFD): This describes a market trend where each successive bar forms a lower high, indicating a pronounced and steady downward movement.
DAILY BULL BEAR ZONE 7165/55
GAMMA FLIP 7177
DELTA FLIP 6871
DAILY RANGE RES 7271 SUP 7138
2 SIGMA RES 7340 SUP 7074
VIX BULL BEAR ZONE 19.5
TRADES & TARGETS
LONG ON REJECT/RECLAIM OF DAILY BULL BEAR ZONE TARGET DAILY RANGE RES
LONG ON REJECT/RECLAIM OF WEEKLY BULL BEAR ZONE TARGET DAILY BULL BEAR ZONE> RTH CLOSE >DAILY RANGE RES
***ADDITIONAL SETUPS & TARGETS HIGHLIGHTED ON THE CHARTS***
(I FADE TESTS OF 2 SIGMA LEVELS ESPECIALLY INTO THE FINAL HOUR OF THE NY CASH SESSION AS 90% OF THE TIME WHEN TESTED THE MARKET WILL CLOSE ABOVE OR BELOW THESE LEVELS)
GOLDMAN SACHS TRADING DESK VIEW - ‘CALM BEFORE THE STORM’
Index recap
US equities had a quiet, mixed session to start a very catalyst-heavy week.
S&P: +12 bps, closed 7,174
NDX: +1 bp, closed 27,306
R2K: +7 bps, closed 2,788
Dow: -13 bps, closed 49,168
MOC: $815m to buy
Total volume: 15.6b shares versus 19.4b YTD daily average
The tape was broadly in wait-and-see mode ahead of major macro and earnings events. Activity was light, and the market avoided making a meaningful directional commitment.
Cross-asset recap
VIX: -358 bps to 18.04
WTI crude: +225 bps to $96.52
US 10Y: +3 bps to 4.33%
Gold: -64 bps to 4,679
DXY: -5 bps to 98.49
Bitcoin: -170 bps to $76,898
The cross-asset message was mixed: oil and yields moved higher, vol softened, gold pulled back, and crypto traded lower. Nothing in the macro tape created an immediate risk-off impulse, but higher crude and higher yields remain important constraints for equity upside.
Session tone
This was a quiet start to a major catalyst week.
Upcoming macro events include:
FOMC + BOC: Wednesday
BOE + ECB: Thursday
US 1Q GDP advance reading: Thursday
ISM Manufacturing: Friday
On the micro side, earnings are the main event, with 44% of S&P market cap reporting this week. Key mega-cap reports:
GOOGL, MSFT, AMZN, META: Wednesday post-close
AAPL: Thursday post-close
Given that setup, today’s muted activity makes sense. Investors were hesitant to add risk aggressively before the biggest earnings and macro stretch of the season.
Main equity story: Semis finally pause
The standout was semis taking a breather after an extreme run.
The group had rallied for 18 straight sessions, gaining roughly 47% over that period. Today, several well-owned high-momentum leaders lagged, with optical names down around 5%.
There was no obvious negative catalyst. The move looked more like:
consolidation after a massive advance
lack of follow-through demand from late last week
profit-taking in crowded winners
earnings-week risk management
This does not break the AI / semiconductor trend, but it does show that the group is stretched and more vulnerable to disappointment after a vertical move.
Flow recap
Floor activity was light, around 3 out of 10.
The floor finished 8% for sale, versus a 30-day average of +23 bps, reflecting a modest sell skew on low activity.
Asset managers
Asset managers were net sellers, with supply concentrated in:
large-cap tech
discretionary
Hedge funds
Hedge fund flow was more balanced, with supply in:
macro
energy
communication services
Demand was seen in:
health care
Semis
Flows across semis skewed better for sale, consistent with the group’s pause after a very large move.
Five near-term warning signs
The market remains structurally constructive, but there are several warning signs that could create a near-term index pullback.
Importantly, the desk view is that a pullback should be treated as a buying opportunity, not necessarily the start of a larger bearish trend.
1. Gross leverage has come in meaningfully
Macro shorts and hedges have been aggressively covered. Last week’s notional US de-grossing was the largest in seven months, since September 2025.
That reduces short-covering fuel and leaves the market more dependent on fresh long demand.
2. Month-end pension rebalance supply
April month-end pension rebalance estimates now point to more than $25b of US equity supply.
That can create a mechanical headwind into month-end, especially if liquidity remains light.
3. CTAs are now meaningfully long
CTAs are now long roughly $32b of S&P 500 exposure after buying:
$23b last week
$53b over the last month
This shifts CTAs from a tailwind to a potential source of downside sensitivity if momentum reverses.
4. Market breadth remains poor
The S&P is holding up, but participation remains narrow. Poor breadth means index strength is heavily dependent on leadership names, especially mega-cap tech and semis.
5. Sentiment and positioning are stretched
US sentiment and investor positioning are now stretched. That does not mean the market must sell off, but it does mean the risk/reward for chasing strength is less attractive in the near term.
Derivatives recap
Vol was little changed as equities traded mixed.
SPX vol: small bid
Skew: offered, especially in the front end
NDX and RUT skew: also offered despite index levels being roughly unchanged
Implied move through Friday: 1.39%
The notable point was the relaxation in skew, while the broader vol surface stayed relatively firm.
Given dealer gamma positioning becomes shorter to the upside, the desk does not see much room for the straddle to compress further ahead of this week’s catalysts. That should keep vol supported into the event cluster.
Options flow was focused on single-name / micro implementations ahead of earnings, especially in tech.
Disclaimer: The material provided is for information purposes only and should not be considered as investment advice. The views, information, or opinions expressed in the text belong solely to the author, and not to the author’s employer, organization, committee or other group or individual or company.
Past performance is not indicative of future results.
High Risk Warning: CFDs are complex instruments and come with a high risk of losing money rapidly due to leverage. 69% and 73% of retail investor accounts lose money when trading CFDs with Tickmill UK Ltd and Tickmill Europe Ltd respectively. You should consider whether you understand how CFDs work and whether you can afford to take the high risk of losing your money.
Futures and Options: Trading futures and options on margin carries a high degree of risk and may result in losses exceeding your initial investment. These products are not suitable for all investors. Ensure you fully understand the risks and take appropriate care to manage your risk.
Patrick has been involved in the financial markets for well over a decade as a self-educated professional trader and money manager. Flitting between the roles of market commentator, analyst and mentor, Patrick has improved the technical skills and psychological stance of literally hundreds of traders – coaching them to become savvy market operators!